Here is a great site for people with a global mindset: Worldmapper — a wonderful way to review the the worldwide situation… The site features maps of the world distorted according to the criteria. In their own words, “Worldmapper is a collection of world maps, using equal area cartograms where territories are re-sized on each map according to a particular variable.”
As of today, the website contains 366 maps, with associated information and a PDF file, covering 99+% of the world’s population, and drawing on information from 200 territories. Much of the data is admittedly old or estimated. Anyway, you’ll get the picture.
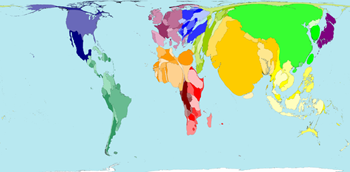
Below is the world map according to population.
The World’s Ecological Footprint – As we know, the United States, China and India have the largest ecological footprints — but it’s the per person CO2 footprint (i.e. combined with the map above) that makes it scary for the US.
- Tertiary education – with the highest percentage of the student-aged population enrolled being “in Finland. Finland is 3.6 times the world average, with 140 times the chance of a tertiary education than in Mozambique.”
- Hazardous Waste – “The three biggest producers are the Russian Federation, United States and Uzbekistan.” And Russia seems to have a big lead in this category.
- Books published – A major European bubble, albeit with old data (1999). The most new titles produced in that year were in the United Kingdom, China and Germany.
- Gender Empowerment – which points out that women are never at parity with men… even in Rwanda where there are now more women in government than men.
- Personal Computers 2002 – Even if this is light years out of date, this PC representation of the world is my favourite esthetically speaking! A kind of Rorschach test too.
For more fun, check out the Worldmapper index here.